Reporting
As part of this release, we will be updating the underlying reporting engine which will involve a number of updates as outlined below. Users will need to hold CTRL and hit F5 to clear the cache and load the updated reporting page.
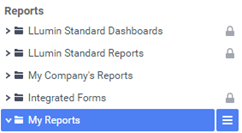
My Reports Folder
- A new folder has been added labeled “My Reports”; any report stored in this folder will only be visible to the currently signed in user. Please refer to the screenshot below:
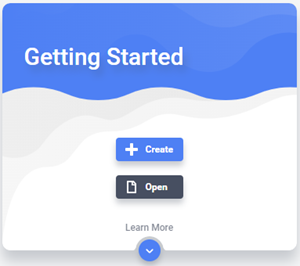
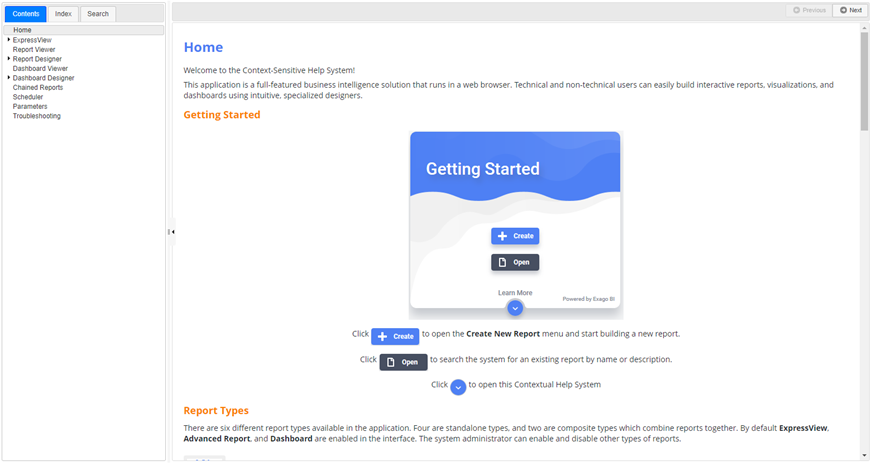
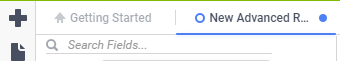
Getting Started Quick Launch
- There is now a Getting Started quick launch section when the Reporting module is first accessed. This quick launch section involves links to Create, Open, and access the interactive Help system.
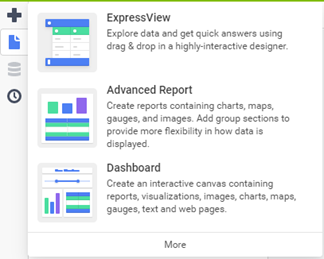
- Create button - When the Create button is clicked, the Plus (+) in the upper left corner of the screen will expand allowing a user to create an ExpressView, Advanced Report, or Dashboard as shown in the screenshot below:
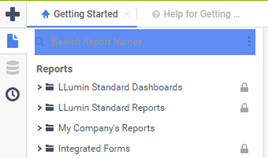
- Open – When the Open button is clicked, the report quick search in the upper left corner of the screen will flash blue directing the user to that search to open a report as needed. Please refer to the screenshot below:
- Learn More – When the blue down arrow beneath “Learn More” is clicked, the interactive Help System will open in a separate tab within the Reporting module. This Help System contains a number of pages providing information on creating reports, editing reports, scheduling reports, built in functions, and much more! *The information contained in the Help System is subject to change as needed.
ExpressView
The ExpressView design experience has been completely revamped. From a new report layout to new themes, export formats and summary building tools.
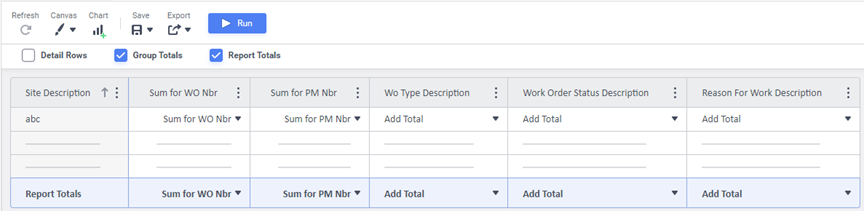
New Report Layout
The ExpressView canvas has been completely overhauled with a new design that is focused on cleaner data presentation and easier consumption for more varied types of report layouts.
- Groups will now appear as individual columns to the left of the data rows.
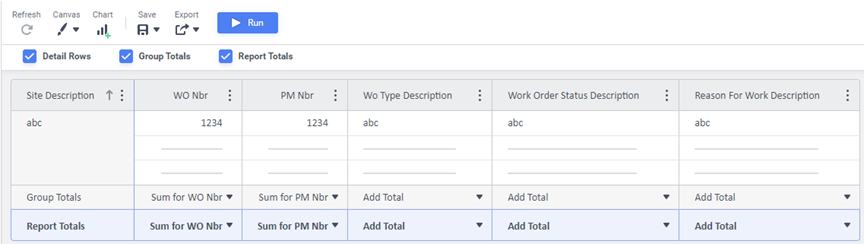
- When Details Rows are suppressed, the canvas will rearrange itself to improve layout of summary data.
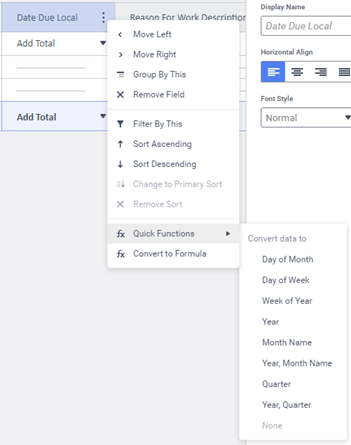
Quick Functions
Quick Functions are pre-defined calculations or operators that transform the fields in either detail fields or group columns. For example, the Month Name quick function applied to a date column will transform the column to only the name of the month of that date. Quick Functions can be used in lieu of building a full formula column, work in conjunction with a formula, or work on a standard detail field or group column by themselves.
Advanced Reports
Advanced Report Wizard Removed
The most obvious change when building a new Advanced Report is the removal of the Advanced Report Wizard. Now, when creating a new report, users will be brought directly to the Report Designer and prompted to add Data Objects (formerly known as Categories). Once users add the Data Category, they are able to begin designing and building immediately in any order or workflow that suits them.
New Toolbar and Design Grid
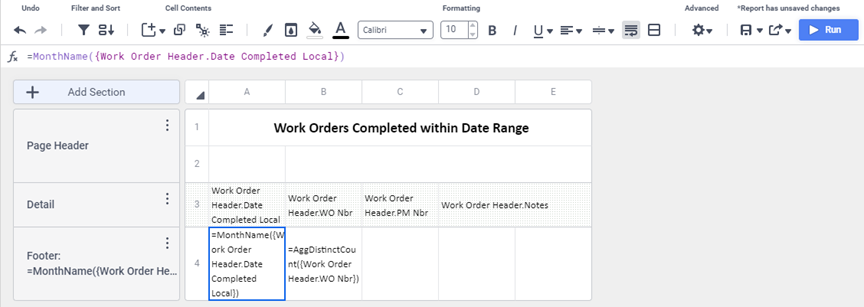
- Controls on the toolbar have been re-arranged to make common controls a single-click away. Dedicated icons for Filters
 and Sorts
  have been added. A new Insert
  menu consolidates all of the functions that add items to cells—charts, maps, gauges, images, formulas and CrossTabs.
 - Reports no longer need to be saved before being executed from the Designer. The Rename and Description menu items have been replaced by a new Save
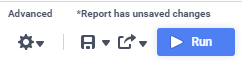
 menu that appears in the application's other designers. A new status message appears above the Save and Run buttons indicating if changes are pending to be saved or not, and a save reminder icon has been added to the navigation tab at the top of the window.
- New Add Section and Select All buttons on the design grid make building, formatting and interacting with the grid simpler with fewer clicks. The column and row menus can now be accessed by clicking on a new Column Menu or Row Menu icon on each. Clicking on a row or column header selects all of the cells in that row or column. Clicking and dragging over multiple cells now selects all of the cells. Clicking and dragging on the edge of a cell moves the contents to a new cell.
- The Linked Reports dialog now supports searching for reports like the Report Tree does.
New Report Viewer
Like the Designer, the Report Viewer has been given a fresh new look.
- Paging controls have been moved to the center of the toolbar, and the former Save User Reportsand Clear Changes menus have been combined into a single Edit
- The Interactive Dockcontaining the Columns, Filters, Sorts and Conditional Filters features has been redesigned and now scrolls as one contiguous unit, showing only the modules that apply to the active report. The Filters module will show more values by default, and selected values appear at the top of the list. A new Open Dock icon makes the dock easier to find.
- Column headers now display prominently at the top of the Report Viewer and are fixed in position, even when scrolling down the page. The headers may be disabled on a report-level with a new Report Viewer Option.
Dashboards
Refresh Reminder in Dashboard Designer
When new reports or visualizations are added to the canvas, or when making changes to existing report or visualization tiles or filters that affect them, they do not automatically query the database and display data. Instead, placeholder data is displayed and a small Refresh Reminder icon will appear in the tile and on the toolbar's Refresh icon.
Interactive Filtering in the Data Source
Dashboards with interactive filters can now pull the interactive filter values from the data source, then execute or re-execute their associated reports with those values in the data source.
- This can lead to considerable performance improvements, in some cases going from a couple of minutes of execution time to under ten seconds.
Visualizations
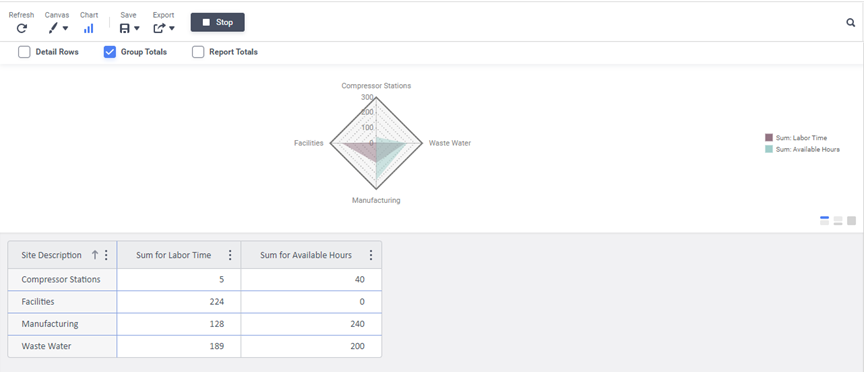
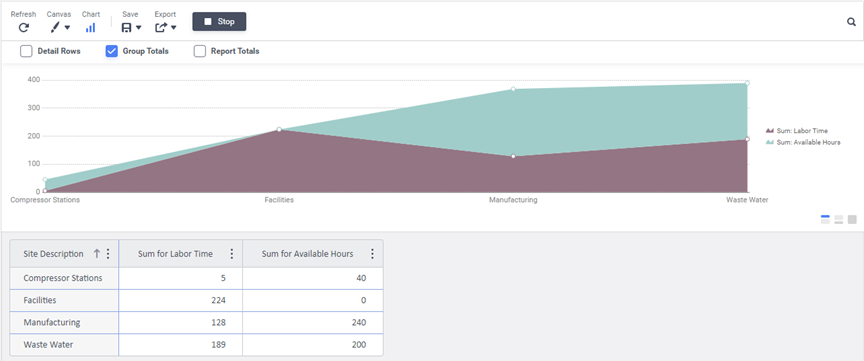
Radar Charts and Stacked Area Charts
Two new chart types: Radar Charts and Stacked Area Charts have been added to the application and are available to ExpressView, Advanced Reports and Dashboards.
READYAsset
Work Orders
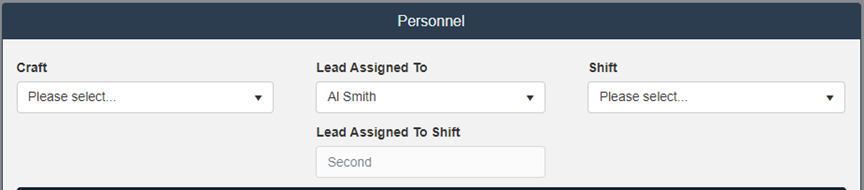
- We have added a read-only field on the Personnel card of a Work Order record below the Lead Assigned To field to indicate the current value for the Lead Assigned To Shift. Please refer to the sample screenshot below:
Assets
- We have made significant improvements to the performance of the Asset Facility View and the Asset Finder in both the Grid View and Tree View. This will also affect the global quick search and Asset lookup performance as well.